SOLUTIONS · Human-computer interaction
Human-computer interaction and product research
Put voice interaction, gaze, interaction logs and facial expression on one timeline, producing quantifiable, reproducible behavioral evidence for product decisions.
Audience
Product / UX / research teams
- Related services
- 3 modules
- Related data
- 3 directions
- Median cross-stream sync error
- 1.4 ms
- From study design to report
- 12 weeks
- Median annotator agreement
- 0.91
- Batch QA pass rate
- 98.7%
01 / Challenges
Human-computer interaction and product research: the data problems we see
These problems rarely come from a single stage. They sit in the gaps between design, collection, annotation and verification.
Behavioral data lives in silos
Voice, interface actions, eye movements and facial expression sit in different tools, so a single interaction cannot be reconstructed.
Lab settings that miss real use
Lab tasks are too clean, and real behavior at home or on the move is never captured.
Metrics disconnected from experience
Teams collect hours of video without defining metrics first, so conclusions stay descriptive and subjective.
Small samples, unstable conclusions
With limited participants, single studies are hard to reproduce and product decisions lack a defensible basis.
02 / Approach
How we move forward
Every project follows the same order: write the question and specification clearly, then move into collection, annotation and verification.
- 01
Questions and metrics first
Clarify the product question to answer, then work backwards to task scripts, metrics and the statistical plan.
- 02
Synchronized multi-device capture
Voice, screen actions, gaze and expression share one timeline, preserving event-level detail.
- 03
Interaction event alignment
Map wake-ups, mistaps, clarifications and abandonments to timecodes, forming a computable event sequence.
- 04
Triangulation
Cross-check behavioral data, subjective scales and interview findings so no single metric drives the conclusion.
03 / Delivery
What you will receive
- Multimodal interaction logs on an aligned timeline
- Usability metric tables and an issue list ranked by severity
- Reproducible study plans and task scripts
- Before-and-after comparison data with segment-level evidence
Behavioral evidence needs one timeline
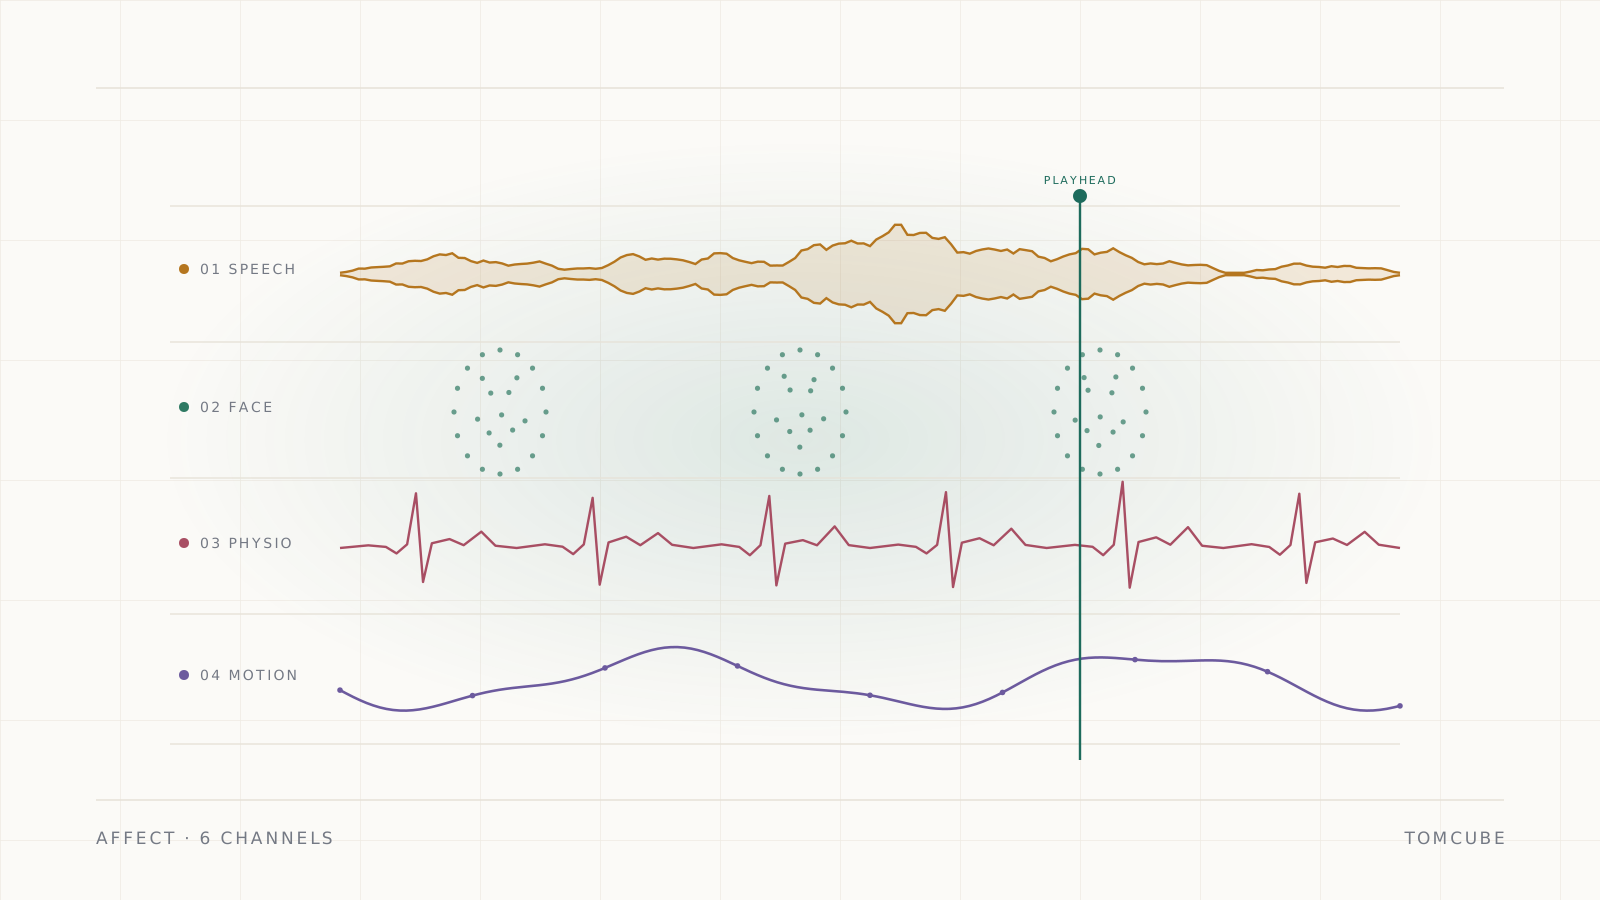
When a user says “it does not work well”, the product team needs to know which step, which action and how long it took. We record voice, interface actions, gaze and facial expression on one timeline, reconstructing a single interaction as a measurable event sequence: wake-up latency, gaze re-scan, mistap, repeated command and abandonment points. The sequence can be replayed task by task, which is what makes it useful in a design review: everyone is looking at the same interaction rather than at a summary slide.
Metrics before collection
Before a study begins we fix the product question, then work backwards to metrics and task scripts. Assessing a voice assistant, for example, focuses on first-wake success rate, clarification turns and task completion time; assessing multimodal interaction focuses on how efficiently gaze and gesture work together. Writing metrics into the plan is what prevents the discovery, after collection, that a key variable was never recorded. We also agree in advance which metrics are diagnostic and which are reported for context, so a single number rarely becomes the whole story. A metric that cannot be computed from the recorded data is dropped before the study starts, not after.
From experiment to product decision
The deliverable is not a pile of video; it is a recomputable metric table, an issue list and segment-level evidence. We rank issues by severity and frequency and attach the relevant timecodes and stills, so design and engineering can locate them directly. After an iteration the same task scripts support a re-test, producing before-and-after comparison data and giving experience improvements a quantifiable basis. Where a result is ambiguous, the segment-level evidence lets the team look at the moment itself, which is often more persuasive than another aggregate chart.
For early exploratory projects, a small round of interviews and task observation can narrow the problem first, before moving into formal multimodal capture. For experience metrics tracked over time, we recommend keeping task scripts, participant groups and metric definitions stable and updating only the product version. That way each re-test reflects real improvement rather than sample noise, and design, engineering and business teams can discuss findings in the same report language. It also keeps the analysis reproducible when the team changes between iterations.
04 / Cases
Illustrative cases
The cases below come from de-identified project settings and are used only to show how we collaborate and what delivery looks like.
Voice assistant usability study
IllustrativeRan task-based testing for a consumer electronics team and identified the key scenarios behind wake-up failures and excessive clarification turns.
6 task types
Multimodal interaction assessment
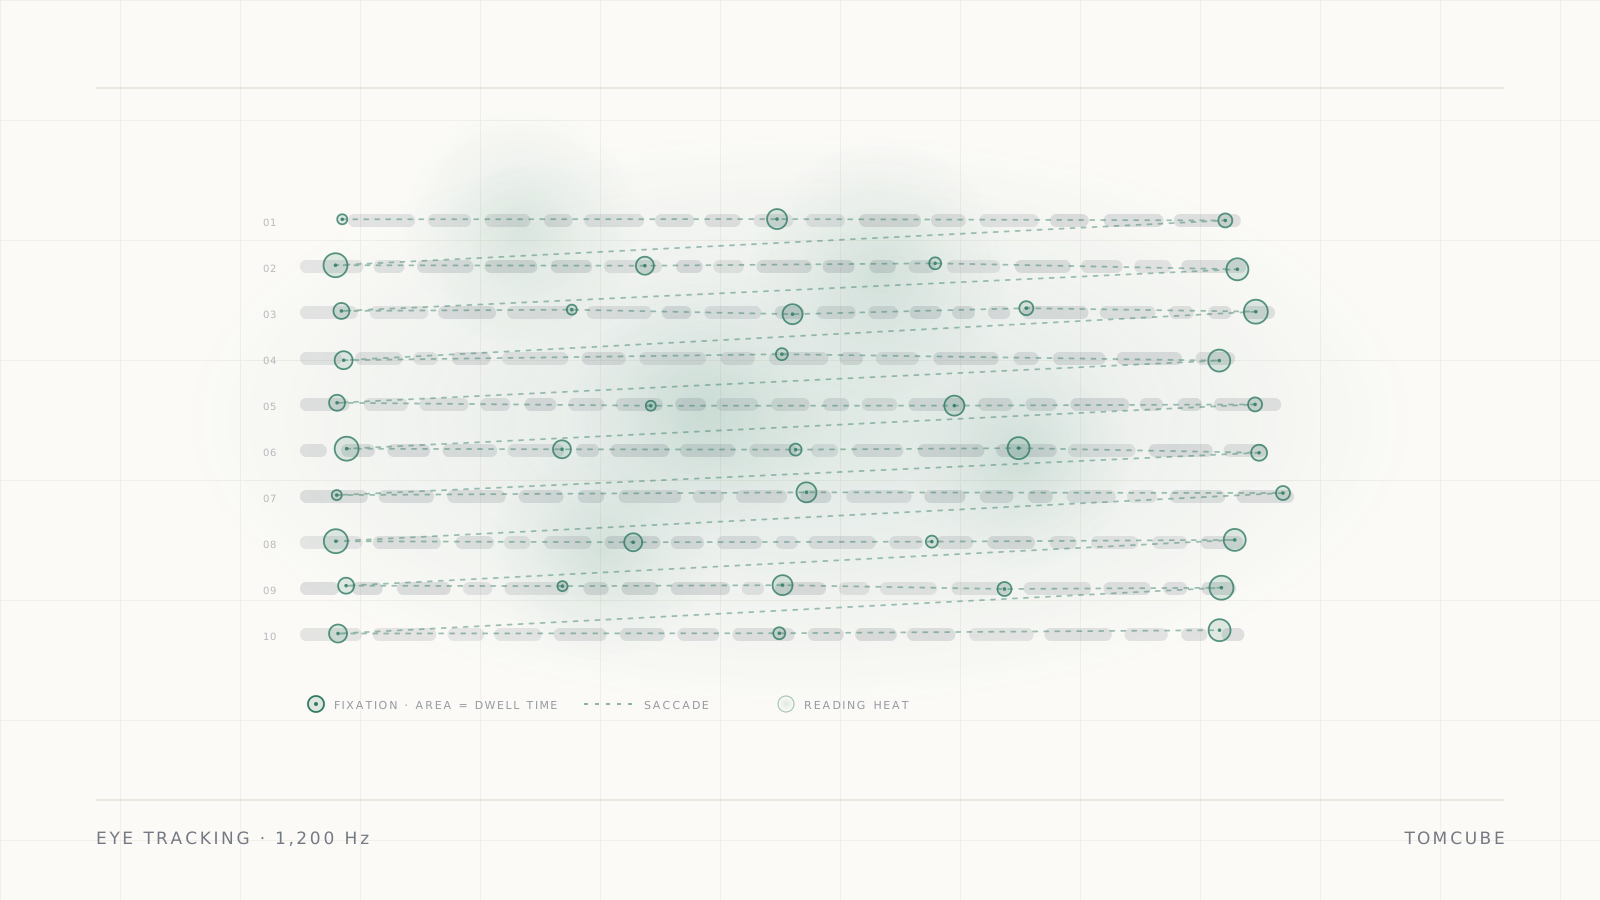
IllustrativeCaptured screen actions, gaze and expression in sync for a software product, producing interaction blockers and an improvement priority list.
24 participants
05 / Related capabilities
Services and data that go with it
A solution is usually delivered as a combination of services; related datasets can support evaluation, annotation or method verification directly.
Related datasets
Data catalog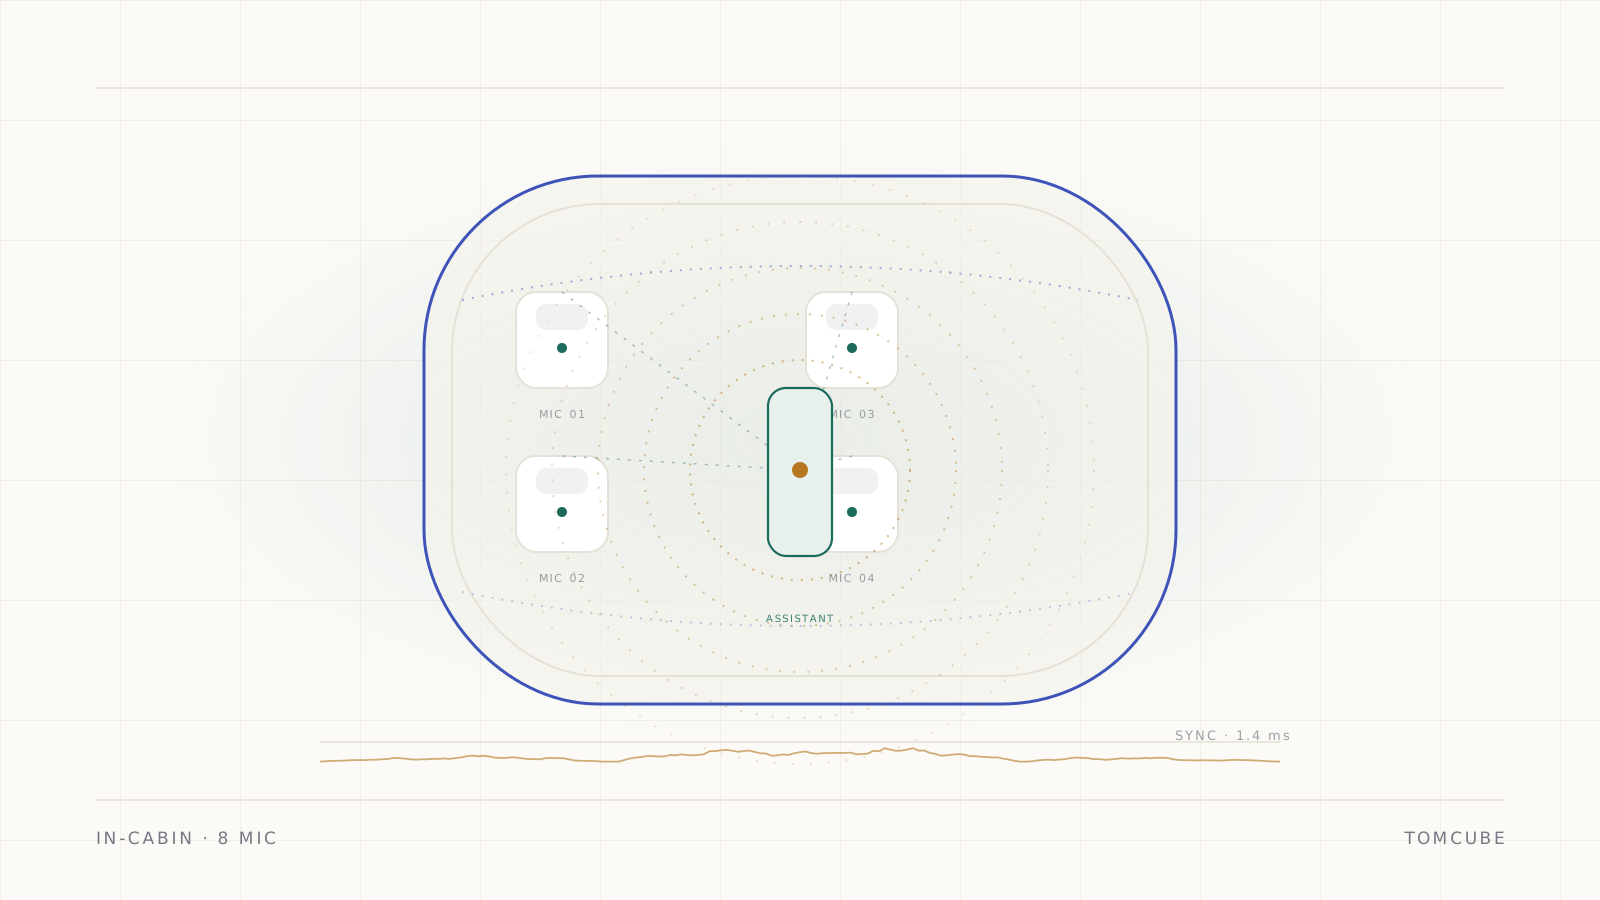
06 / FAQ
Common questions
Frequent questions about timeline, licensing and how we collaborate.
Can you capture in real usage environments?
Yes. We support home, office and mobile settings, using portable devices for synchronized recording while preserving environmental context.
How large does the sample need to be?
It depends on the metrics and effect size. We run a power estimate at the planning stage and use stratified sampling or top-up samples when needed.
Can you analyze and report without collecting new data?
Yes. If video, logs or questionnaire data already exist, we start with a data check-up, then align analysis and annotation.
How do you keep studies reproducible?
We deliver task scripts, device lists, environment records and analysis scripts, so the same process can be re-run after an iteration.
Start a project
Start with a data check-up
Tell us the question you need to answer, the data you already have and your time constraints. We will come back with an executable plan outline and budget range.
Reply within one business day · NDA and data licensing supported · Dedicated academic track